Summary
In Hess’s Utica Point Pleasant development, a standard DFIT interpretation yielded a permeability estimate of nearly 1 microdarcy, much higher than the company’s internal estimate of 10-20 nanodarcies (Cipolla et al., 2018). The DFIT was studied by McClure et al. (2019) as part of the ResFrac DFIT Study, and the results confirmed the operators belief that permeability is in the range of 10s of nd. We found that the 1 microdarcy estimate was caused by ‘false’ radial flow arising from multiphase effects in gas shale. ‘False radial’ appears to be common in gas shale, and results in greatly overoptimistic permeability estimates.
Subsequently, we performed a follow-up study (Fowler et al., 2019) to demonstrate the impact of the permeability estimate on cluster spacing and well spacing. Because the study was made public, real cost values were not used, and so the results are ‘generic’ and do not represent actual recommendations to the operator.
ResFrac was used to history match production for two different scenarios: a high permeability model and a low permeability model. It was possible to match production data with the different values of permeability because the linear flow equation has a non-unique tradeoff between fracture surface area and the square root of permeability. The low permeability model required minimal tuning to match the data. However, the high permeability history match required such low fracture surface area that it was not possible to run a hydraulic fracturing simulation that could match the data.To force a match, fracture geometry had to be imposed as a model input. Further confirming the ‘low permeability’ interpretation, the low permeability model had much earlier production interference between adjacent wells, consistent with the operator’s experience.

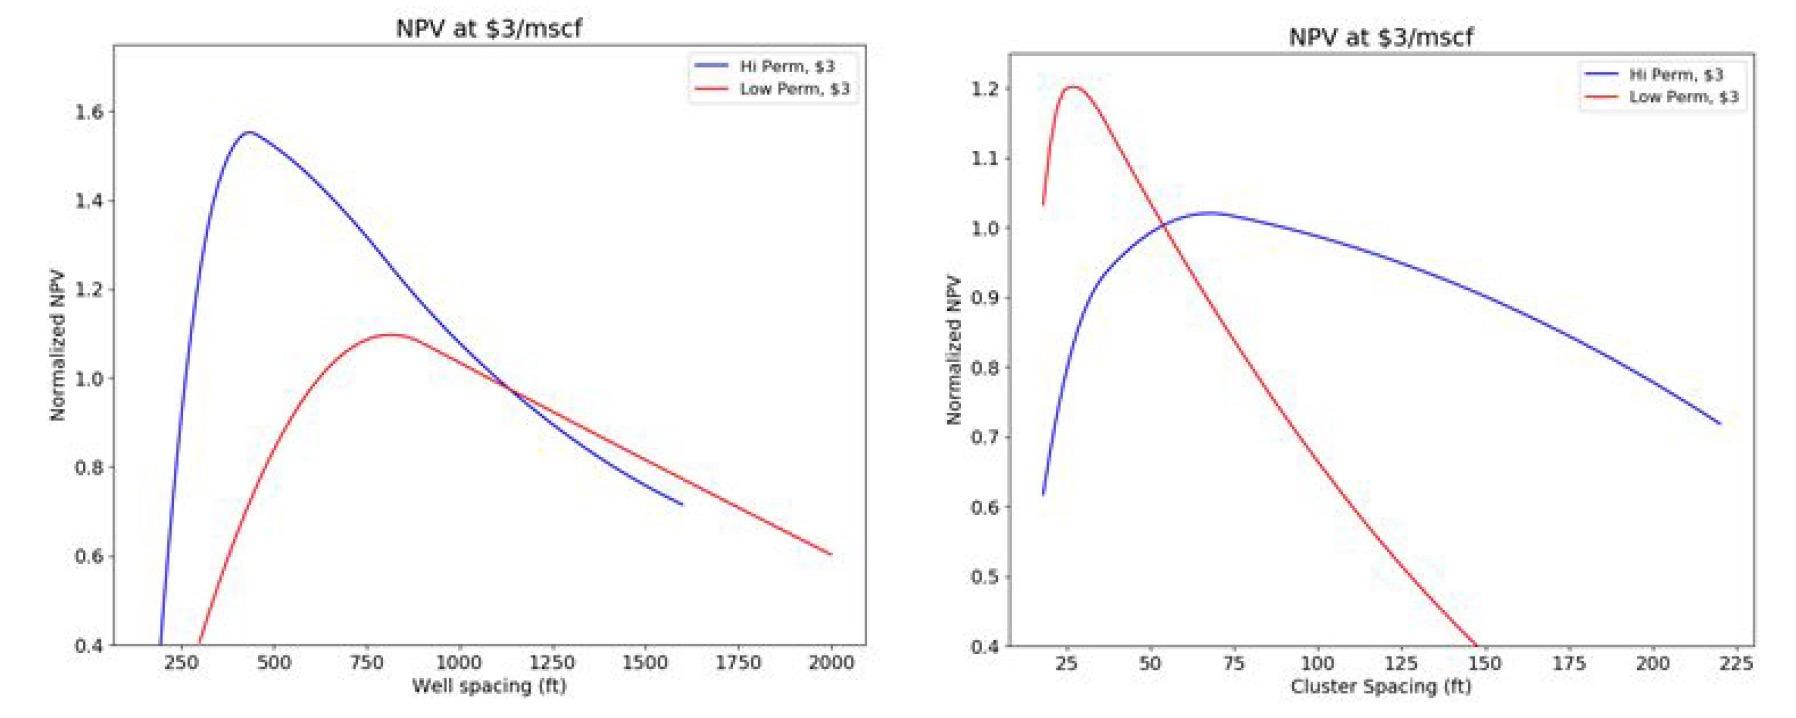
After history matching the two models, a sequence of simulations was performed to calculate ‘net-present value’ versus cluster and well spacing. The results show that the high permeability assumption causes overcapitalization of the development area. In the high permeability model, optimal well spacing is ~400 ft, whereas in the low permeability model, optimal well spacing is ~800 ft. The high permeability model yields an optimal cluster spacing of 75 ft versus the optimal value of 30 ft in the low permeability model. Using the 75 ft spacing instead of the 30 ft spacing in the low permeability model results in more than a 30% reduction in NPV.

The study demonstrates the profound impact that the permeability estimate has on development plans and economics. McClure et al. (2019) provide a step-by-step interpretation procedure to improve the accuracy and consistency of DFIT permeability estimation.
Cipolla, Craig, Constance Gilbert, Aviral Sharma, and John LeBas. 2018. Case History of Completion Optimization in the Utica. Paper SPE-189838-MS presented at the SPE Hydraulic Fracturing Technology Conference & Exhibition, The Woodlands, TX. Link.
Fowler, Garrett, Mark McClure, and Craig Cipolla. 2019. A Utica Case Study: The Impact of Permeability Estimates on History Matching, Fracture Length, and Well Spacing. Paper SPE-195980-MS presented at the SPE Annual Technology Conference and Exhibition, Calgary, Alberta. Link.
McClure, Mark, Vidya Bammidi, Craig Cipolla, Dave Cramer, Lucas Martin, Alexei A Savitski, Dave Sobernheim, and Kate Voller. 2019. A Collaborative Study on DFIT Interpretation: Integrating Modeling, Field Data, and Analytical Techniques. Paper presented at the Unconventional Resources Technology Conference, Denver, Colorado. Link.